Surface Area Computation Benchmark for Torus
This benchmark focuses on the computational task of computing surface areas.
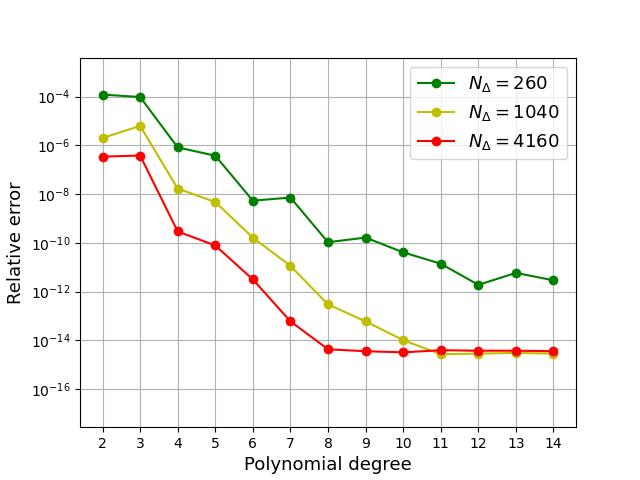
We perform the high-order volume elements (HOVE) algorithm for a torus \(T^2_{r,R}\) with an inner radius \(r=1\) and an outer radius \(R=2\). We employ the distmesh tool to generate Delaunay triangulations, resulting in a mesh with \(N_{\Delta}=260\) triangles for the torus.
Imports
import matplotlib.pyplot as plt
import numpy as np
from math import pi
from time import time
import scipy.io
from numba import njit
Local imports
import surfgeopy as sp
In this experiment, we start with a coarse mesh and iteratively refine it twice for enhanced accuracy.
mesh_path ="../meshes/torus_260.mat"

R=2
r=1

@njit(fastmath=True)
def phi(x: np.ndarray):
    ph = np.sqrt(x[0]*x[0] + x[1]*x[1])
    return (ph - R)*(ph - R) + x[2]*x[2] - r*r

@njit(fastmath=True)
def dphi(x: np.ndarray):
    ph = np.sqrt(x[0]*x[0] + x[1]*x[1])
    return np.array([-2*R*x[0]/ph + 2*x[0],-2*R*x[1]/ph + 2*x[1],2*x[2]])
Error Evaluation Function
def err_t(intp_degree,lp_degree,mesh_path, refinement):
    f1=lambda _: 1
    t0 = time()
    areas = sp.integration(phi,dphi, mesh_path,intp_degree,lp_degree,refinement, f1)
    t1 = time()
    sum_area =sum(areas)
    t1 = time()
    exact_area =(2*pi*R)*(2*pi*r)

    print("Relative error: ", abs(sum_area - exact_area) / exact_area)
    print ("The main function takes:",{(t1-t0)})
    error=abs(sum_area - exact_area) / exact_area
    return error
Polynomial degree
Nrange = list(range(2,15))
lp_degree=float("inf")
error1=[]
error2=[]
error3=[]
for n in Nrange:
    if n%1==0:print(n)
    erro1 = err_t(int(n),lp_degree,mesh_path,0)
    error1.append(erro1)
    erro2 = err_t(n,lp_degree,mesh_path, 1)
    error2.append(erro2)
    erro3 = err_t(n,lp_degree,mesh_path, 2)
    error3.append(erro3)
Result Visualization
plt.semilogy(Nrange, error1, '-og')
plt.semilogy(Nrange, error2, '-oy')
plt.semilogy(Nrange, error3, '-or')
plt.xlabel("Polynomial degree", fontsize=13)
plt.ylabel("Relative error", fontsize=13)
plt.legend(['$N_{\Delta}=260$','$N_{\Delta}=1040$','$N_{\Delta}=4160$'],prop={'size': 13})
plt.xticks(np.arange(min(Nrange), max(Nrange)+1, 1.0))
plt.ylim([2.758195177427762e-18,3.9514540203871754e-03])
plt.grid()